

Two vendors can both say “synthetic respondents” and mean opposite things.
One has modelled a real population from survey data and scored its answers against responses it never saw. The other has typed a paragraph describing a customer and asked a chatbot to play the part. Same three words. No shared standard underneath them. Ipsos, Qualtrics and NielsenIQ are all selling a version now, so the vocabulary will get more crowded, and less precise, before it settles.
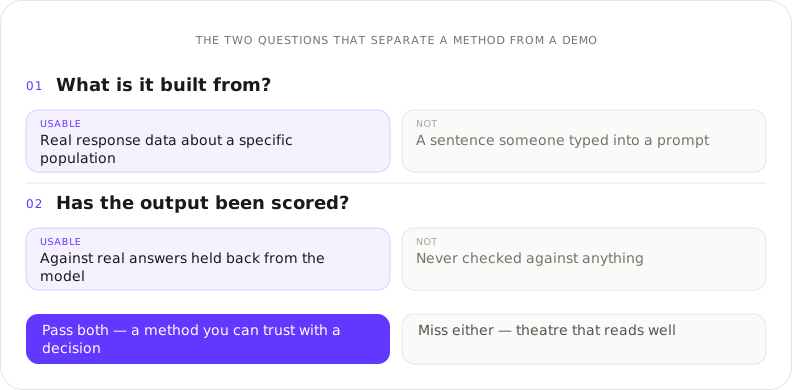
Two questions cut through all of it. What is the thing built from? And has anyone scored its answers against real answers it was never shown? Everything else is packaging.
What is a synthetic respondent?
A synthetic respondent is a modelled participant, built from real survey or behavioural data, that answers a research question the way a member of a defined population would. One on its own is not much use. Model the whole population and you get a distribution instead of a single manufactured opinion, which is why we work at the level of a synthetic audience rather than a lone respondent. A single voice cannot disagree with itself.
Respondents, personas, panels, focus groups: what is the difference?
The words get used loosely enough that you can compare a method with a format and never notice the swap. Here is the taxonomy that matters.
Term | What it actually is | Built from | A distribution? |
|---|---|---|---|
Synthetic persona | A described character, often handed to a general model to act out | A description someone wrote | No, one voice |
Synthetic respondent | One modelled participant answering as a member of a defined population | Real response data about that population | As part of an audience |
Synthetic audience | The whole modelled population, questioned together and read by segment | Real survey or first-party data, held as a reusable audience | Yes, across waves |
Synthetic survey | A format: a structured instrument run against synthetic respondents | Whatever the respondents were built from | Depends on them |
AI focus group | A format: a moderated conversation with synthetic respondents | Whatever the respondents were built from | Probes reasons |
Synthetic data generation | A different discipline: statistically similar records for privacy or training | A real dataset's statistical structure | Not a research method |
The format tells you nothing about the quality. A synthetic survey and an AI focus group run against ungrounded personas are both junk. The same two run against respondents built from real data and scored against a holdout are both usable. Buyers evaluate the interface and forget to ask what is underneath it.
Persistence is worth more than it sounds. A panel you can return to lets you compare this month with last month, because the respondents are the same respondents. Regenerate the audience from scratch each time and wave-on-wave comparison quietly becomes meaningless. A surprising number of tools work exactly that way.
Synthetic data generation is a different job. It shows up in the same search results and solves a privacy and volume problem, not a research question. Confusing the two is the most common mix-up in the category.
How is a synthetic audience built?
Four stages, and the last one is the point.
Grounding. Real survey data from leading global survey companies, your own datasets, or both. Large language models take on characteristics drawn from that data, so the difference from a general model is the grounding, not the absence of a model.
Construction. We build the audience one individual at a time, from what the data shows about beliefs, preferences and behaviour. Building at that level is what makes a distribution possible.
Questioning. Surveys, focus groups, message tests, image tests. Answers come back in seconds.
Validation. We hold a portion of the real data back and never show it. The audience answers questions drawn from it, and we score those answers against what the real people actually said. The evaluation questions never touch the build, so a good score cannot come from memorisation.
The full mechanics are in what a synthetic audience is and how it works.
Do the answers actually sound human?
There is a published test, and the result cuts both ways, which is the interesting part. We put blind comparisons of a synthetic discussion group against a real one, across three topics (UK current affairs, AI in banking and football club ownership) to three AI judges. In six of the nine judgments, they rated the synthetic group the more authentic of the two.

Models are trained to be articulate. Real people ramble, contradict themselves, and say things that make them look bad. A synthetic transcript that reads better than a real one may just be reading too well. So a fair question for any vendor, us included: has your qualitative output ever been mistaken for real, and do you treat that as a pass or a red flag?
Where does it go wrong, and why?
Each failure has a specific cause. Knowing the cause turns “sounds risky” into a question you can put to a vendor.
Stereotype completion
Ask a model built on demographic labels what a 34-year-old woman in Leeds thinks, and it hands back the most statistically available answer for that description: a stereotype, delivered fluently. Walter Lippmann named the trap in 1922, when he coined the modern sense of the word. For the most part, he wrote, we do not first see and then define; we define first, then see. A label-keyed model does the same.
Cause. Built from which boxes someone ticks, not what they said.
Test. Ask about a segment you know cold. Does the answer contain anything you did not already assume?
False consensus and a flattened spread
A model can nail the average and still crush the spread, reporting 80% agreement where the real figure was 55%. Scott Page's diversity prediction theorem makes this exact: the error of a group of predictions equals the average individual error minus the diversity of those predictions. Diversity is a measurable component of the accuracy. Flatten the spread and a distribution measure marks you down for it, so a method can look strong on the average and get the shape of opinion badly wrong.
Cause. Modelling the population average instead of the individuals in it.
Test. Ask to see the full distribution, and where the dissent sits, not just the mean.
Social desirability and polished rationalisation
Models are trained to be helpful and articulate, so they produce reasoning tidier than the real thing. Real respondents contradict themselves and give unflattering answers.
Cause. A model optimised to sound good, answering as if it were a person.
Test. Go looking for answers that make your product look bad. If there are none, be suspicious, not relieved.
Overclaiming from apparent precision
A synthetic result arrives formatted, complete, and free of the missing data that would flag uncertainty in a real survey, so it looks more precise than it is.
Cause. Clean output with no visible error bars.
Test. Is the validation stated next to the number, every time?
Hallucination from weak grounding
Thin input still produces confident output. The model does not degrade gracefully, and it will not tell you the data was thin.
Cause. Too little real data behind the audience.
Test. What is the minimum data you require, and what do you refuse to model without it?
Four of those five are one failure in different clothes: an average passing itself off as an answer. Building the audience one real person at a time, and scoring on a distribution measure, is what catches it.
Why should 99% worry you?
One number is worth carrying into a procurement meeting: about 94%. Ask a real person the same question twice in one survey and they change their answer roughly six times in a hundred. So no method has a clean 100% to be measured against, human panels included. A vendor quoting 99% is either measuring something forgiving, or claiming a consistency real people do not have. For context, on the same measure an ungrounded frontier model with no real data behind it reaches about 65%, and a validated synthetic audience sits at up to 92%, just below the human ceiling.
Those are all NDAM figures, which is the point of naming the measure: an NDAM score and a 1-MAE score answer different questions, and a number quoted without its measure is not comparable to anything. The two we report, and what each one scores, are set out in the side-by-side comparison and on our accuracy methodology.
One related wrinkle worth knowing: where you ask changes the answer you get. We published on this in March 2026, Where You Ask Matters, with the plain-English version in the same survey run across seven panels.
Six questions to take into any pitch
Rather than characterise anyone else's methodology, the sharper move is to know which questions separate a real offer from a repackaged one. Take these to any vendor, us included.
Ask the vendor | Worry if you hear | What a good answer sounds like |
|---|---|---|
What is the audience built from? | “Advanced AI models”, with no dataset named | Named real datasets |
Which accuracy measure, and what does it score? | A bare percentage with no measure attached | A named measure, with its behaviour explained |
Will you validate on our data before we buy? | An internal benchmark only | Yes, on a holdout you control |
Can I see the full distribution, not just the average? | One summarised voice per question | Yes, with dissenting segments identified |
What will you refuse to do? | “It works for everything” | A specific list of question types |
How is drift monitored? | “The model keeps learning” | Periodic re-validation against fresh real answers |
The fifth row is the most diagnostic. A vendor with no refusals has not tested the edges of its own method, so you will end up finding them instead, usually mid-project.
What does this look like when it works?
The protocol above is not hypothetical. Across studies, holdout validation on a client's own data lands at up to 92% on NDAM: part of the real dataset is kept back, the audience is built from the rest, and the answers are scored against the slice the model never saw. Because the held-out questions never touch audience creation, a good score cannot come from memorisation.
What that makes possible in practice is covered in The Times case study, which follows one newsroom from a single validation result through to running research on demand across three teams.
Three things sit around that, and they are covered properly elsewhere so this piece does not repeat them. You still need real people for anything on the record, anything physical, anything genuinely new, and for calibration, where the real panel becomes the layer that keeps the model honest. The hard part of adopting it is cultural rather than technical. And most teams end up using a synthetic audience in three places: before human research to narrow the field, between waves to keep a tracker alive, and on the questions that never made the research plan at all.
You ask, we answer
Do synthetic respondents remove sampling error?
No. They move the uncertainty from sampling variance to model fidelity, and fidelity is task-specific. That is why validation runs per audience and per question type, rather than as one figure for the whole tool.
How do you know the model is not just repeating its training data?
The evaluation data is held out, and in our testing it is private data not available on the internet. A model reproducing training data would fall over on questions it has never seen.
Is synthetic data generation the same thing?
No, and it is the most common mix-up in the category. Synthetic data generation produces statistically similar records to solve a privacy or volume problem. A synthetic audience answers research questions as a modelled population. Different disciplines, different outputs, similar search results.
What is the difference between a synthetic respondent and a synthetic audience?
A respondent is one modelled participant; an audience is the whole modelled population, questioned together and read by segment. The audience is the useful unit, because a single respondent gives you one manufactured opinion and cannot show you where your customers disagree with each other.

